
OpenTelemetry
TIP
This page is a config reference for OpenTelemetry. If you're looking to set up and integrate with OpenTelemetry, we recommend taking a look at Integrate with OpenTelemetry instead.
To start using OpenTelemetry, install @elysia/opentelemetry and apply plugin to any instance.
import { Elysia } from 'elysia'
import { opentelemetry } from '@elysia/opentelemetry'

import { BatchSpanProcessor } from '@opentelemetry/sdk-trace-node'
import { OTLPTraceExporter } from '@opentelemetry/exporter-trace-otlp-proto'

new Elysia()
	.use(
		opentelemetry({
			spanProcessors: [
				new BatchSpanProcessor(
					new OTLPTraceExporter()
				)
			]
		})
	)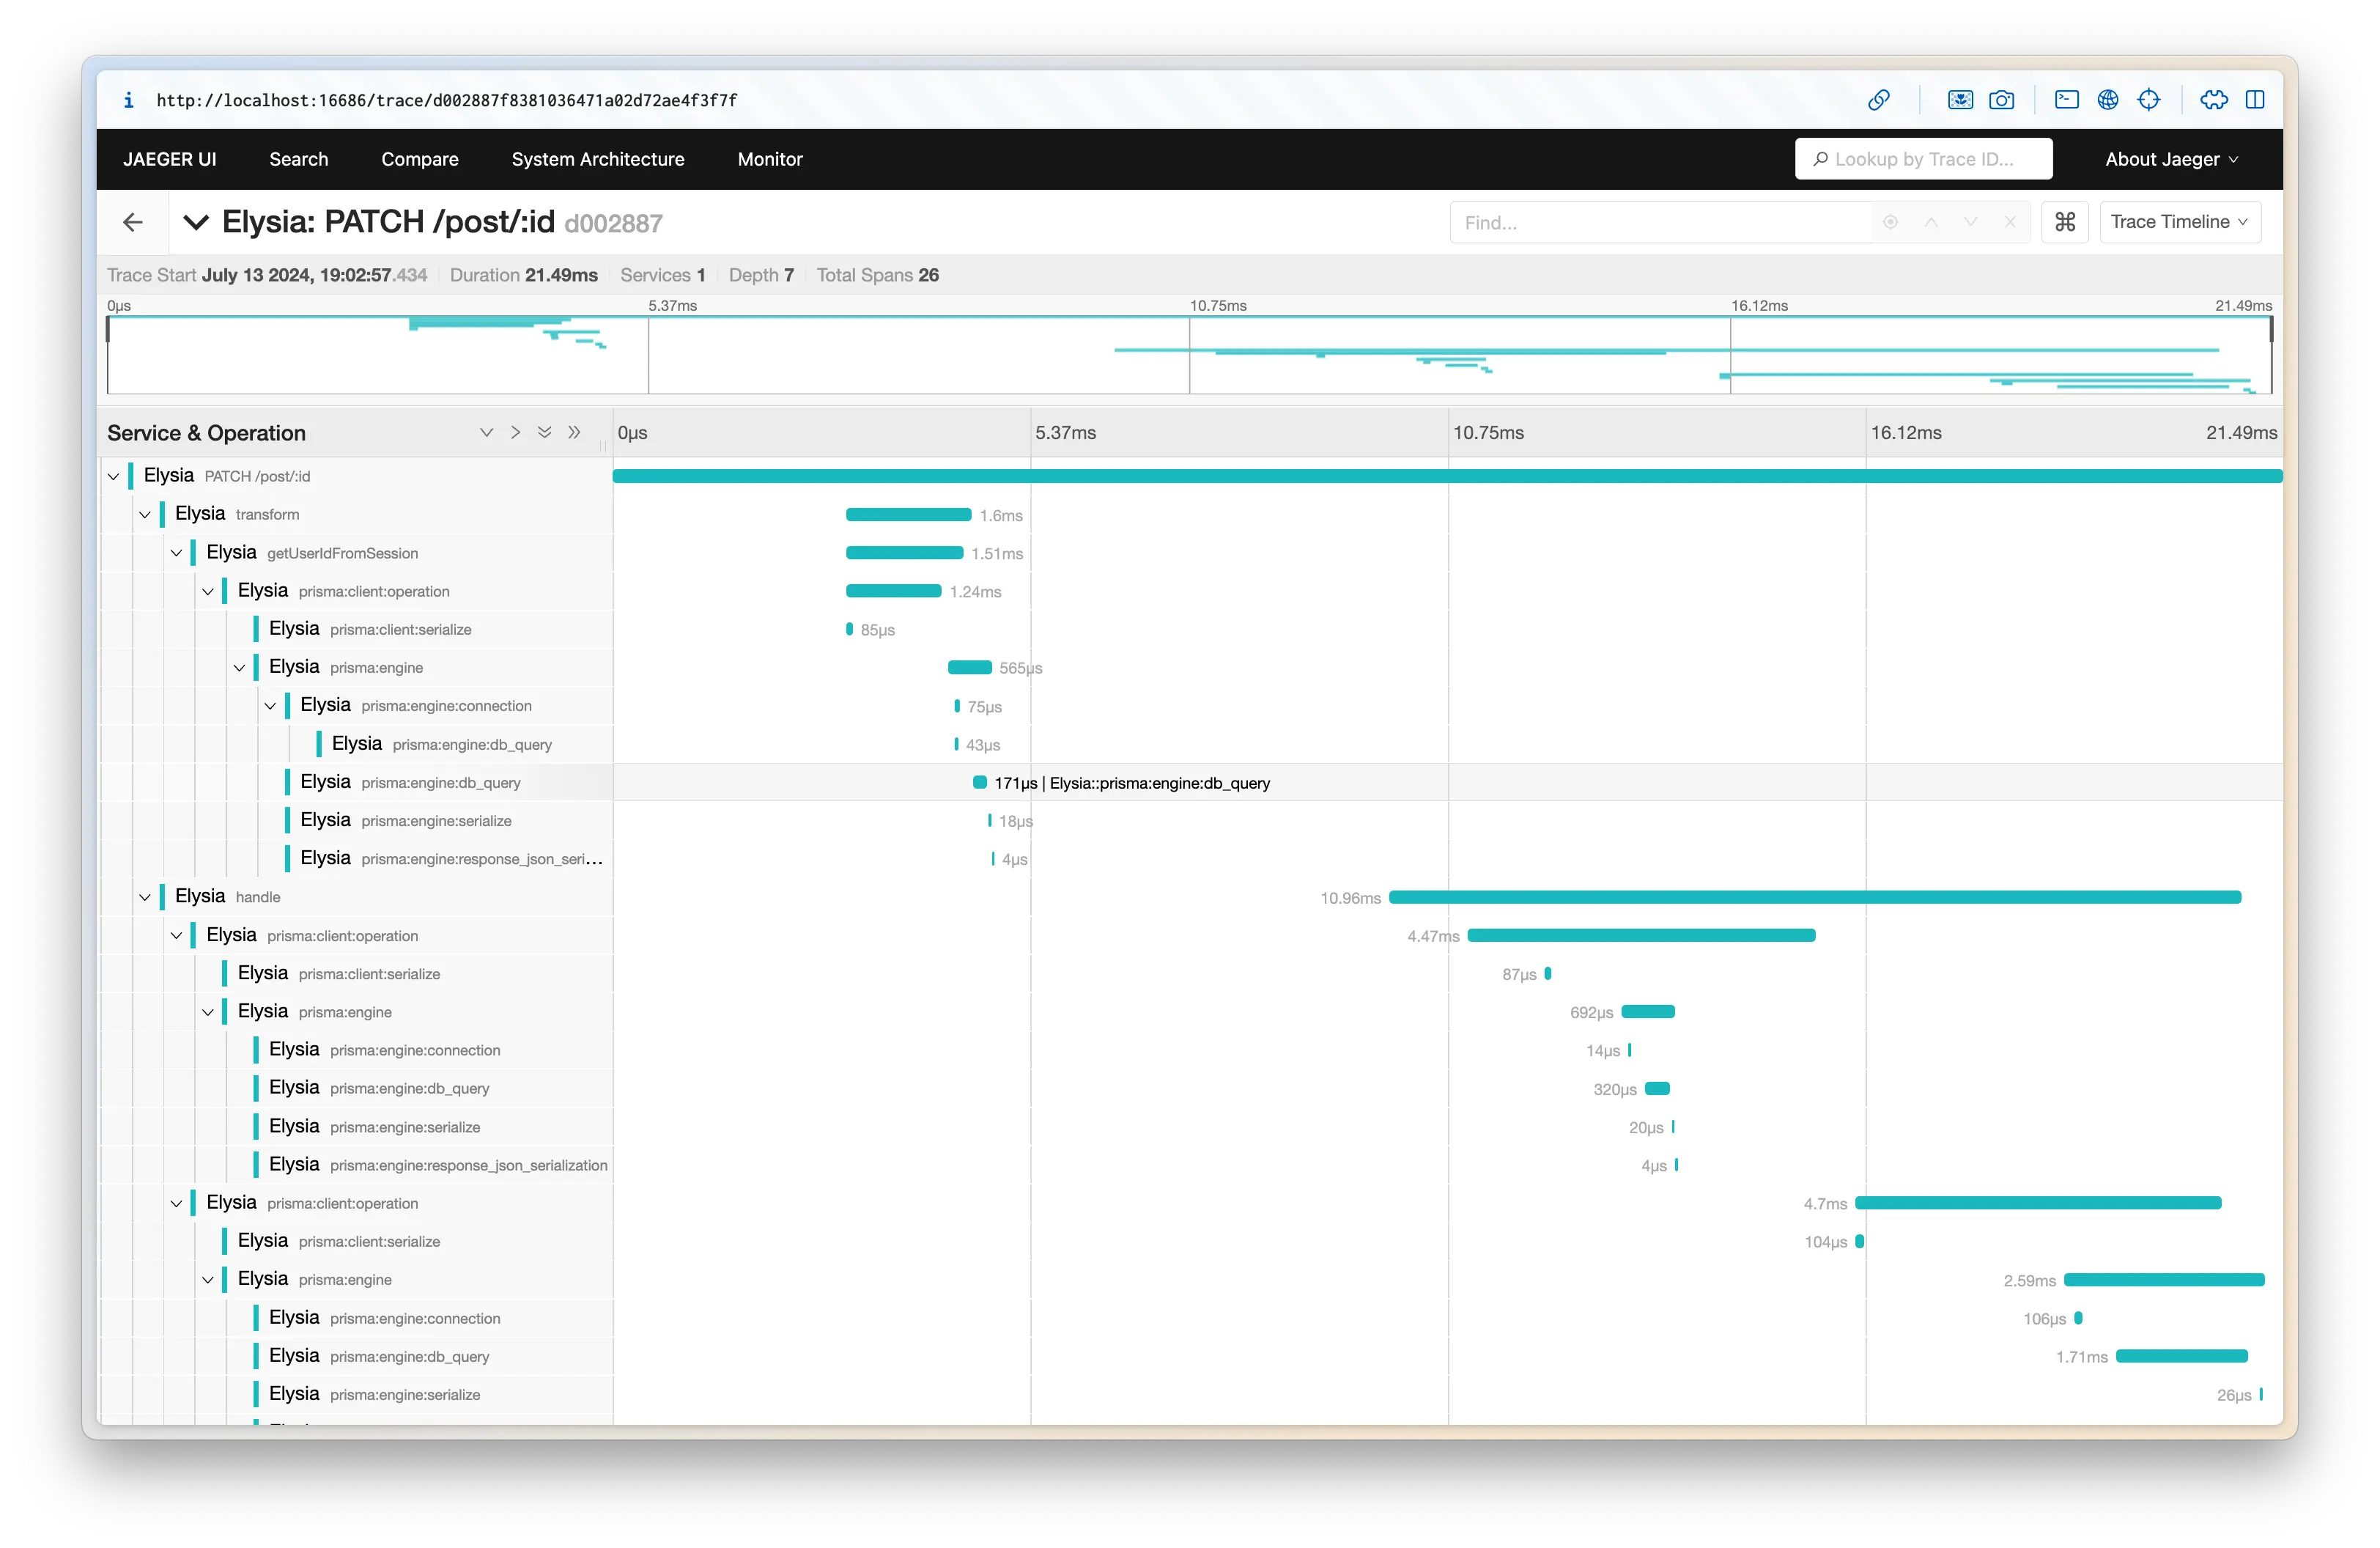
Elysia OpenTelemetry will collect spans from any library compatible with the OpenTelemetry standard, and will apply parent and child span automatically.
Usage
See opentelemetry for usage and utilities
Config
This plugin extends OpenTelemetry SDK parameters options.
Below is a config which is accepted by the plugin
autoDetectResources - boolean
Detect resources automatically from the environment using the default resource detectors.
default: true
contextManager - ContextManager
Use a custom context manager.
default: AsyncHooksContextManager
textMapPropagator - TextMapPropagator
Use a custom propagator.
default: CompositePropagator using W3C Trace Context and Baggage
metricReader - MetricReader
Add a MetricReader that will be passed to the MeterProvider.
views - View[]
A list of views to be passed to the MeterProvider.
Accepts an array of View-instances. This parameter can be used to configure explicit bucket sizes of histogram metrics.
instrumentations - (Instrumentation | Instrumentation[])[]
Configure instrumentations.
By default getNodeAutoInstrumentations is enabled, if you want to enable them you can use either metapackage or configure each instrumentation individually.
default: getNodeAutoInstrumentations()
resource - IResource
Configure a resource.
Resources may also be detected by using the autoDetectResources method of the SDK.
resourceDetectors - Array<Detector | DetectorSync>
Configure resource detectors. By default, the resource detectors are [envDetector, processDetector, hostDetector]. NOTE: In order to enable the detection, the parameter autoDetectResources has to be true.
If resourceDetectors was not set, you can also use the environment variable OTEL_NODE_RESOURCE_DETECTORS to enable only certain detectors, or completely disable them:
- env
- host
- os
- process
- serviceinstance (experimental)
- all - enable all resource detectors above
- none - disable resource detection
For example, to enable only the env, host detectors:
export OTEL_NODE_RESOURCE_DETECTORS="env,host"sampler - Sampler
Configure a custom sampler. By default, all traces will be sampled.
serviceName - string
Namespace to be identified as.
spanProcessors - SpanProcessor[]
An array of span processors to register to the tracer provider.
traceExporter - SpanExporter
Configure a trace exporter. If an exporter is configured, it will be used with a BatchSpanProcessor.
If an exporter OR span processor is not configured programmatically, this package will auto setup the default otlp exporter with http/protobuf protocol with a BatchSpanProcessor.
spanLimits - SpanLimits
Configure tracing parameters. These are the same trace parameters used to configure a tracer.